|
[VIEWED 5110
TIMES]
|
SAVE! for ease of future access.
|
|
|
|
भउते

Please log in to subscribe to भउते's postings.
Posted on 09-09-07 9:49
PM
Reply
[Subscribe]
|
Login in to Rate this Post:
0  ?
? 
|
| |
Hello LeTeX Experts ! I need to insert a picture in the table. How do I do it in LeTeX, guys? मिल्छ कि मिल्दैन ? ट्राइ गरेको, मिल्ला जस्तो देखिएन त 
नत्र ब्याक टु वर्ड हुन पर्ने भो। 
अग्रिम धन्यबाद मीत्रहरु। 
Last edited: 09-Sep-07 10:17 PM
|
| |
|
|
|
|
cleopatra

Please log in to subscribe to cleopatra's postings.
Posted on 09-10-07 12:11
AM
Reply
[Subscribe]
|
Login in to Rate this Post:
0  ?
? 
|
| |
I am not an expert. Neither I've tried to insert pictures. However, I will try to find it out. But it is gonna take some time. 
|
| |
|
|
world_map

Please log in to subscribe to world_map's postings.
Posted on 09-10-07 12:15
AM
Reply
[Subscribe]
|
Login in to Rate this Post:
0  ?
? 
|
| |
|
|
| |
|
|
Neural

Please log in to subscribe to Neural's postings.
Posted on 09-10-07 12:29
AM
Reply
[Subscribe]
|
Login in to Rate this Post:
0  ?
? 
|
| |
. Bhautey, I have never come across with such case of inserting FIG. inside a Table, especially while writing manuscript. I usually create Figure in Tgif with file extension .obj then convert it into .eps Then, u can insert this .eps file on your manuscript filename.tex . You might know the command used to insert the Figure. I wonder what ur figure will do inside the table !!!!! Either you create Table and present your obtained values in it OR illustrate it in fig. OR show both individually. Last edited: 10-Sep-07 12:30 AM
Last edited: 10-Sep-07 12:30 AM
|
| |
|
|
gaalab

Please log in to subscribe to gaalab's postings.
Posted on 09-10-07 10:32
AM
Reply
[Subscribe]
|
Login in to Rate this Post:
0  ?
? 
|
| |
भउते गुरु, table र tabular हरुभित्र घुसाउन नमिल्ने रैछ? खै, आफूले नचला' ७-८ महिना भइसको। तैपनि, subfigure भित्र त राख्न मिल्छ केरे। google तिर यसो स्टाइलसिट खोज्यो भने मिलाउन मिल्छ क्यारे। IEEEtran.cls भन्ने खोजेर यसो एडिट गर्यो भने मिल्न पर्ने हो। मैले चैं त्यही IEEE का स्टाइलसिटहरु बेसमा लेख्ने गर्थैं। न्युरलले भन्या झैं tgif वा gnuplot वा अन्य कुनैबाट पहिले नै फिगरलाई टेबलजस्तो बना'र आलटाल पनि पार्न सकिन्छ। तर tgif बाट बनाको पिक्चरहरुभन्दा gnuplot बाट सिधै टेबलजस्तो बना'र .eps बनाको चैं राम्रो देखिन्छ केरे नि। अस्तु:॥
|
| |
|
|
भउते

Please log in to subscribe to भउते's postings.
Posted on 09-10-07 11:46
AM
Reply
[Subscribe]
|
Login in to Rate this Post:
0  ?
? 
|
| |
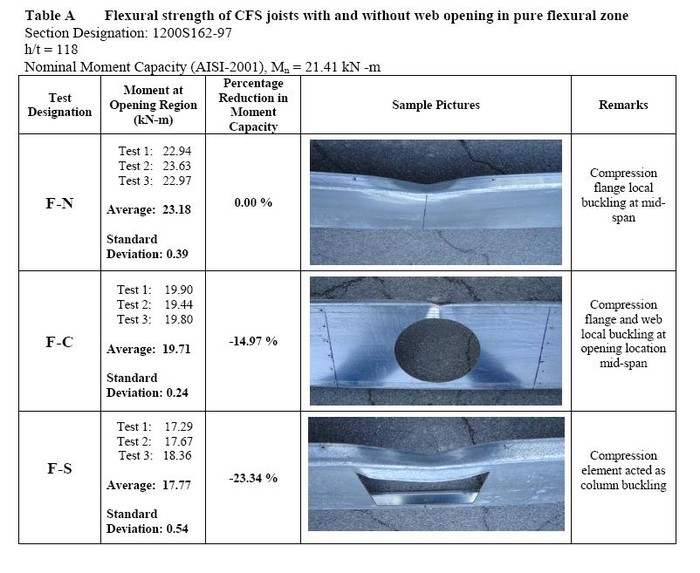
Cleo, thank you for your response. I would really appreciate your time and help. I am ready to wait for you till all eternity, ................re kya.  Mappy, there was a day I was fighting to death with just inserting Fig. in .tex file. But now, I am looking for a way to insert Fig. inside Table Environment.  Anyways, thank you. Neural, yes, I need to insert Fig. and Eqn inside a Table. I am not sure if I am just wasting my time on Mission Impossible.  मिल्दैन भन्ने स्योर लाग्छ भने नो इन्ट्री साइन देखाम है।  I was looking for something like this: \begin{table}{cc} \centering \caption{*}\label{*} Value & \begin{figure} \end{figure} Value & Value \end{table} सिधै हुन्छ कि भनेर गोर्खे बुद्धी लगा'को, यत्राको हुनु।  गालव गुरु, धन्यबाद। म चैँ सबै फिगर पि डि एफ मा प्रिन्ट गरेर इन्सर्ट गर्छु। नानाथरी चलाउँदा नानाथरी टेन्सन भो।  अब त्यै डेटालाई नि फिगर बनाएर सबफिगर गर्नु पर्ला जस्तो छ।  थ्याङ्कु गाइज। Any other suggestions please !  My table supposed to be something like this. 
Last edited: 10-Sep-07 11:48 AM

|
| |
|
|
भउते

Please log in to subscribe to भउते's postings.
Posted on 09-10-07 4:24
PM
Reply
[Subscribe]
|
Login in to Rate this Post:
0  ?
? 
|
| |
कोही छैन !   LooTe bro, ThapaP, Flippy and aru ko ko chhan diggaj diggaj haru sabai, please help na. थापा ब्रो र फ्लिपीले अलिक पहिले बिजुलीको गृहकार्यमा सघा'को सम्झीरा'छु के।  
|
| |
|
|
Neural

Please log in to subscribe to Neural's postings.
Posted on 09-10-07 8:22
PM
Reply
[Subscribe]
|
Login in to Rate this Post:
0  ?
? 
|
| |
.
Bhaute,
I never did it before; just tried and its done!
Congrat.
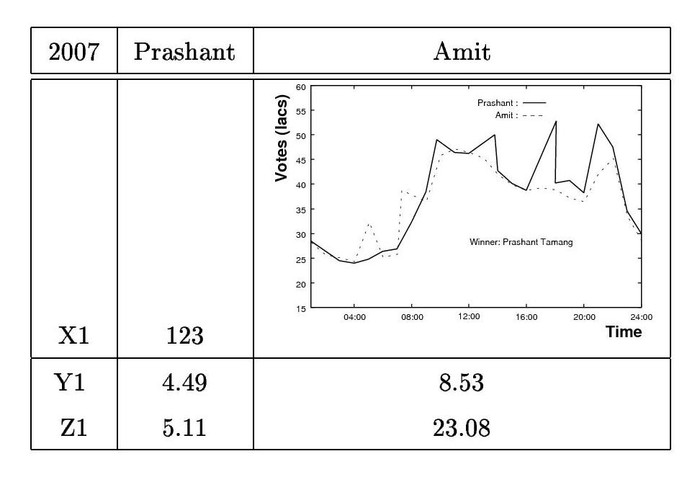
The following table shows how Prashant Tamang wins Indian Idol-3.
Give a look. Fig. attached (.eps)
Follow this command:
\begin{table}
\begin{center}
{\bf Table 1: Comparative analysis of Prashant and Amit.}
\vspace*{2mm}
\begin{tabular}{|c|c|c|}\hline
{2007} & Prashant & Amit \\
\hline\hline
X1 & 123 & \includegraphics[scale=.35]{Figure.eps} \\ \hline
Y1~ & 4.49 & 8.53 \\ \hline
Z1~& 5.11 & 23.08 \\
\hline
\end{tabular}
\end{center}
\end{table}
====
To insert figure: u just need to insert this command ==> \includegraphics[scale=.35]{Figure.eps}
u can change the scale as u wish.
create figure in gnuplot --> .obj ---> .eps ---> and use above figure command OUTPUT Last edited: 10-Sep-07 08:23 PM Last edited: 10-Sep-07 08:26 PM
Last edited: 10-Sep-07 08:27 PM

|
| |
|
|
भउते

Please log in to subscribe to भउते's postings.
Posted on 09-10-07 8:39
PM
Reply
[Subscribe]
|
Login in to Rate this Post:
0  ?
? 
|
| |
Neural, Thank you soooooooooooooo much ! That is exactly what I was looking for. I really appreciate your help. I was about to give up this LaTeX stuffs. Now I am back on it. oooooooohuuuuuuuuuuuuuuuuuuuuuuuuuu I am sooooooooooo happy ! Thank you again. 
|
| |
